
Data Analysis
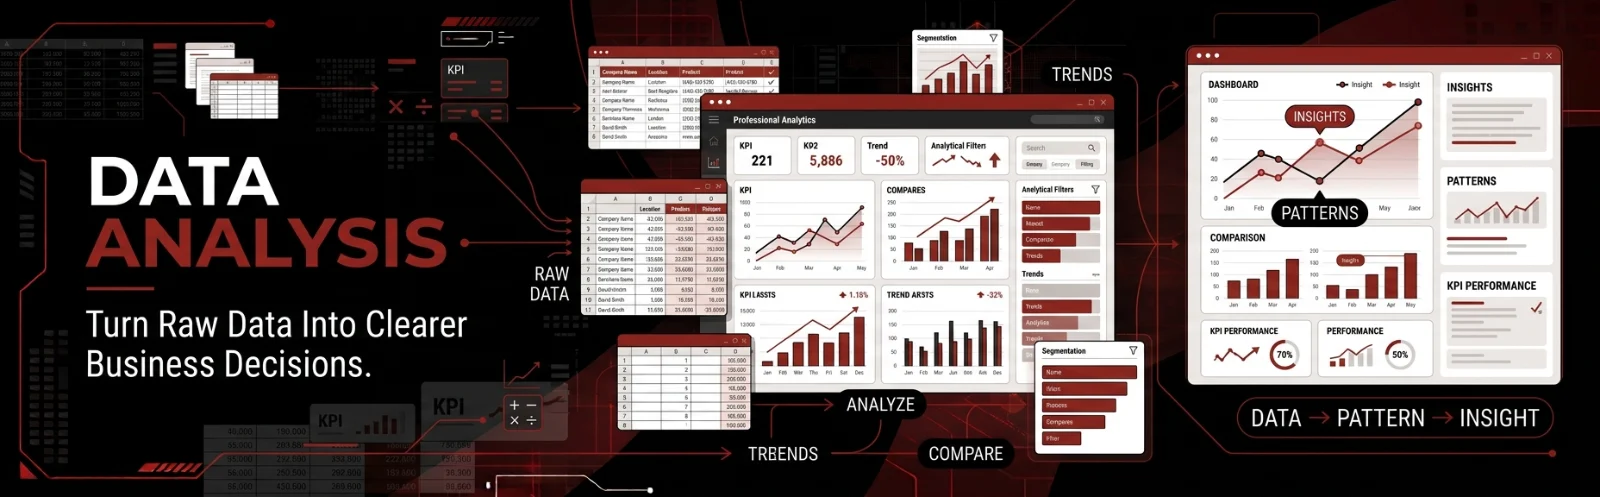
📊 At A1 Infinity Nexus, data analysis turns spreadsheets, business records, reports, and other raw information into clear patterns, meaningful findings, and practical next steps. Our approach focuses on understanding what the data is showing, why important changes are happening, and where the findings can support better business decisions.
🔎 What Professional Data Analysis Involves
Effective data analysis goes beyond calculating totals or creating attractive charts. It involves preparing information, examining relationships and trends, comparing performance, identifying unusual results, and presenting findings in a way that connects directly to the business question being investigated.
Depending on the requirement, analysis can answer different questions: What happened? Why did it happen? What patterns are visible? What may happen next? What action should be considered? A1 Infinity Nexus keeps the analysis aligned with the actual business objective rather than producing numbers without useful context.
📥 What We Can Analyze
Sales & Revenue Data - Analyze sales records, revenue figures, order information, product performance, customer activity, and period-over-period results to identify meaningful changes. We can organize key figures into comparisons and summaries that make performance easier to understand and discuss.
Customer & CRM Data - Examine customer records, lead activity, conversion information, follow-up data, customer segments, and account activity to identify patterns within your customer or prospect base. Findings can support CRM Management, Customer Success, Customer Support, and Sales Development workflows.
Lead & Marketing Data - Review lead sources, prospect lists, campaign-related information, response activity, qualification results, and conversion figures to understand where opportunities are coming from. This can help teams compare channels, identify patterns, and focus attention on the information that matters most.
E-commerce & Marketplace Data - Analyze product, order, listing, sales, customer, and marketplace information to identify performance patterns across online business activities. This can support E-commerce Operations, Marketplace Management, Product Listing Management, and broader operational decisions.
Operational Data - Examine task volumes, turnaround times, workload information, recurring activities, errors, completion rates, and other operational records to identify bottlenecks or performance patterns. The findings can connect naturally with Business Operations, Operations Management, and Process Improvement.
Research & Market Data - Analyze structured research findings, market information, competitor data, survey results, pricing information, or other collected datasets to identify patterns and meaningful comparisons. This can strengthen the practical value of Market Research and Web Research projects.
🧮 Analysis Methods We Can Apply
Descriptive Analysis
Summarize historical or current information to show what has happened within the available dataset. This can include totals, averages, percentages, distributions, comparisons, trends, rankings, and other summaries that make large amounts of information easier to understand and review.
Diagnostic Analysis
Go beyond the surface result to investigate why a change, gap, increase, decrease, or unusual pattern may have occurred. By comparing relevant segments, periods, categories, sources, or other available variables, we can help identify relationships and possible contributing factors within the data.
Trend & Comparative Analysis
Compare performance across different periods, categories, products, locations, customer groups, lead sources, or other meaningful dimensions. This can reveal recurring patterns, changes over time, areas of growth, weaker-performing segments, and differences that may otherwise be difficult to notice in raw records.
Segmentation Analysis
Break larger datasets into useful groups so the information can be examined from more specific perspectives. Depending on the project, segments may include customer types, locations, products, industries, lead sources, order values, activity levels, or other business-defined categories.
Performance Analysis
Measure relevant business indicators against previous periods, targets, categories, teams, products, or other agreed benchmarks. The objective is to turn raw figures into a clearer view of performance and highlight areas that deserve further attention.
Exception & Anomaly Review
Identify unusual values, unexpected changes, inconsistent records, or results that differ significantly from the surrounding information. These findings can then be reviewed more closely to determine whether they represent genuine business changes, data-quality issues, or situations requiring further investigation.
🧠 From Raw Data to Useful Business Insight
Start With the Business Question
We first identify what you actually need to understand from the data rather than beginning with charts or calculations. This keeps the analysis focused on a defined business question, performance issue, opportunity, comparison, or decision that the information needs to support.
Prepare the Information
Before drawing conclusions, the available dataset needs to be reviewed for structure, completeness, formatting, duplicates, missing values, and other issues that may affect the analysis. Where necessary, data can be organized and prepared so the calculations and comparisons are based on a more consistent working dataset.
Examine the Patterns
The prepared information is explored through relevant calculations, comparisons, groupings, trends, and relationships. The analysis is selected according to the type of data and the question being answered rather than applying the same method to every business dataset.
Investigate Important Findings
Not every number deserves equal attention. We focus on meaningful changes, unusual results, significant differences, recurring patterns, and other findings that may have practical relevance to the business, while keeping the limits of the available data clear.
Present the Results Clearly
Findings can be organized into tables, summaries, charts, dashboards, or written observations depending on what will be most useful for your team. The objective is to make the important information understandable without forcing decision-makers to work through the raw dataset themselves.
Connect Findings to Action
Where appropriate, the final analysis can highlight areas that deserve attention, questions that require further investigation, or practical opportunities suggested by the available information. The goal is not simply to report numbers but to make the analysis useful within the wider business workflow.
📈 Reports, Dashboards & Visual Analysis
Data becomes easier to understand when important findings are presented in a clear visual structure. Depending on the project, we can organize analyzed information into summary tables, charts, trend views, KPI reporting, comparative reports, dashboards, and other practical formats that help teams review performance.
Microsoft Excel supports tools such as PivotTables, PivotCharts, Power Query, and data models for summarizing, transforming, analyzing, and visualizing business information. Google Sheets and other agreed platforms can also be used when they fit your existing workflow and collaboration requirements.
⚠️ Common Data Analysis Challenges
| Challenge | How We Can Help |
|---|---|
| Too much raw information | Organize large datasets into meaningful summaries, categories, comparisons, and views that are easier to interpret. |
| Reports show numbers but not patterns | Analyze changes, trends, segments, and relationships to identify what the figures may be showing. |
| Performance changes are difficult to explain | Compare relevant periods, categories, sources, or business factors to investigate meaningful differences. |
| Important information is buried in spreadsheets | Extract key findings and present them through structured summaries, tables, charts, or dashboards. |
| Different reports use inconsistent structures | Standardize the analytical approach and organize information around agreed metrics and reporting requirements. |
| Decisions rely heavily on assumptions | Provide evidence from the available business data so important questions can be examined using measurable information. |
💎 What Better Data Analysis Can Give Your Business
Clearer performance visibility - Instead of reviewing disconnected figures across multiple spreadsheets or reports, your team can work from organized analysis that highlights important movements, comparisons, and patterns. This makes it easier to understand where performance is changing and which areas deserve closer attention.
Faster identification of business patterns - Structured analysis can reveal recurring trends, differences between groups, changes over time, and unusual results that may be difficult to recognize from raw records. These findings can help your team investigate opportunities and problems with greater clarity.
More useful reporting - A well-structured analysis can turn raw operational or commercial information into concise summaries, tables, visualizations, and reports that are easier for stakeholders to review. This reduces the need to repeatedly interpret the same raw data manually.
Stronger operational understanding - Analysis can connect data from areas such as sales, customers, leads, products, workloads, and processes to provide a clearer picture of what is happening across the business. This can support better coordination between Data Management, Operations Management, CRM Management, and Reporting & Analytics.
Better-informed business discussions - When important questions are supported by organized evidence, teams can discuss performance, priorities, opportunities, and problems with a clearer understanding of the information available. Analysis does not replace business judgment; it gives that judgment better information to work with.
🧩 Where Data Analysis Fits Across Your Business
Data analysis can support sales, customer operations, lead generation, CRM, e-commerce, marketplaces, real estate, research, administration, finance-related business reporting, project coordination, and operational workflows whenever structured information is available.
For real estate teams, analysis can help examine leads, listings, property information, response activity, and pipeline-related records. For e-commerce businesses, it can support product, order, marketplace, and customer analysis. For service businesses, it can help evaluate customer activity, lead sources, workloads, performance metrics, and operational records.
🛠️ Tools & Platforms
| Category | Tools & Platforms |
|---|---|
| Spreadsheets & Analysis | Microsoft Excel, Google Sheets |
| Data Transformation | Excel Power Query, structured spreadsheet workflows |
| Visualization & Reporting | Excel Charts, PivotCharts, dashboards, Google Sheets visualizations |
| Business Intelligence | Microsoft Power BI, other agreed BI platforms |
| Business Systems | CRM platforms, e-commerce platforms, marketplace systems, databases |
| Collaboration & Documentation | Google Workspace, Microsoft Office, Notion |
| Project Coordination | Trello, Asana, ClickUp, Monday.com |
🎯 Built Around Your Business Questions
Every analysis project starts with a different question, dataset, and expected outcome. A1 Infinity Nexus does not force every business into the same reporting format or analytical structure.
We can work with your existing spreadsheets, exported reports, CRM records, operational datasets, research information, or other agreed business data and shape the analysis around the information you actually have available. Where the dataset has limitations, those limitations can be identified rather than presenting unsupported conclusions.
🔗 Connect Data Analysis With the Rest of Your Workflow
- Data Management - Prepare, clean, organize, maintain, and structure the underlying business information before and alongside analysis so your working data remains more consistent and usable.
- Reporting & Analytics - Turn recurring business information into structured reporting and performance views that help teams monitor important metrics and review changes over time.
- Why Choose Us - See how A1 Infinity Nexus approaches business support through clear communication, detail-focused execution, flexible support, specialist capability, business context, and consistent accountability.
🚀 Turn Business Data Into Clearer Answers
Raw information only becomes valuable when your business can understand what it means and use the findings effectively. A1 Infinity Nexus provides practical data analysis support that connects your available information with the questions, patterns, comparisons, and performance areas your business needs to understand.
Whether you need a one-time analysis, recurring reporting support, spreadsheet analysis, performance review, customer-data analysis, sales analysis, or broader business insight, we can build the work around your existing data and objectives.
📩 Make More Sense of the Data You Already Have
Share the dataset, report, spreadsheet, business question, or performance issue you want to investigate. A1 Infinity Nexus can help structure the analysis around the information available and produce findings in a format your team can actually use.
💼 Flexible Engagements
Hourly & Project-Based Data Analysis Services
A1 Infinity Nexus provides hourly and project-based data analysis support, making it possible to request focused analysis for a specific dataset or establish ongoing analytical support around recurring business reporting and information needs.
What is included
- Review your current workflow, goals, tools, and recurring challenges
- Create a clear task plan with priorities, ownership, and deadlines
- Complete and document the work with careful quality checks
- Provide proactive progress updates and flag issues before they grow
- Build reusable templates, checklists, and standard operating procedures
- Track results and continuously improve the process
Tools & platforms
Google Workspace, Microsoft Office, Slack, Zoom, Notion, Trello, Asana
Expected outcome
More time, fewer missed details, clear priorities, and dependable day-to-day execution.
Who this is for
Hourly & Project-Based Services
We work on both hourly and project-based engagements.